CLI documentation
Basic arguments
Show help command:
$ pypepa -h
Set logging level (the default is NONE):
$ pypepa --log {DEBUG, INFO, ERROR, NONE}
Calculations
Calculate steady state for bank scenario. The putput is by default directed to your terminal.
$ pypepa -st models/bankscenario.pepa

Statespace of models/bankscenario.pepa.1 has 7 states

Steady state vector
Using ; delimiter
1;Idle,WaitingForCustomer,WaitingForEmployee;0.08333333333333337
2;Informed,WaitingForCustomer,WaitingForEmployee;0.25
3;WaitingBankResponse,RequestReceived,WaitingForEmployee;0.16666666666666666
4;WaitingBankResponse,CustomerNotReliable,WaitingForEmployee;0.16666666666666666
5;WaitingBankResponse,CustomerReliable,WaitingForEmployee;0.16666666666666666
6;WaitingBankResponse,WaitingManagerResponse,EvaluatingOffer;0.08333333333333333
7;OfferReceived,WaitingForCustomer,WaitingForEmployee;0.08333333333333333
Calculate actions’ throughput:
$ pypepa -th models/bankscenario.pepa

Statespace of models/bankscenario.pepa.1 has 7 states

Throuhoutput (successful action completion in one time unit)

readInformation                          0.08333333333333337
createLoanRequest                              0.25
getNotReliableMessage                    0.16666666666666666
badOffer                                 0.08333333333333333
askManager                               0.16666666666666666
reset                                    0.08333333333333333
goodOffer                                0.08333333333333333
checkReliability                         0.3333333333333333
You can calculate transient time proability for some number of time steps:
$ pypepa --transient 5 models/bankscenario.pepa

Transient analysis from time 0 to 10

Using ; delimiter
1;Idle,WaitingForCustomer,WaitingForEmployee;0.08351202761947342
2;Informed,WaitingForCustomer,WaitingForEmployee;0.2500169897974121
3;WaitingBankResponse,RequestReceived,WaitingForEmployee;0.16662129023697114
4;WaitingBankResponse,CustomerNotReliable,WaitingForEmployee;0.16657721277634494
5;WaitingBankResponse,CustomerReliable,WaitingForEmployee;0.16657721277634485
6;WaitingBankResponse,WaitingManagerResponse,EvaluatingOffer;0.08328947039778702
7;OfferReceived,WaitingForCustomer,WaitingForEmployee;0.08340579639566591
You can choose a solver by specifying --solver|-s {direct, sparse}.
By defalt we use sparse solver with LIL matrix becuase it is faster and in overall matrices generated from PEPA models are sparse. There is also an insignificant difference in results.
pypepa allows you to visualise all PEPA components and the whole state space of a model by specifying -gd switch. The generated graphiz dot files are by deault saved in dots folder in the current directory. You can browse dot files with xdot, which you need to install first.
$ pypepa -gd bankdots models/bankscenario.pepa
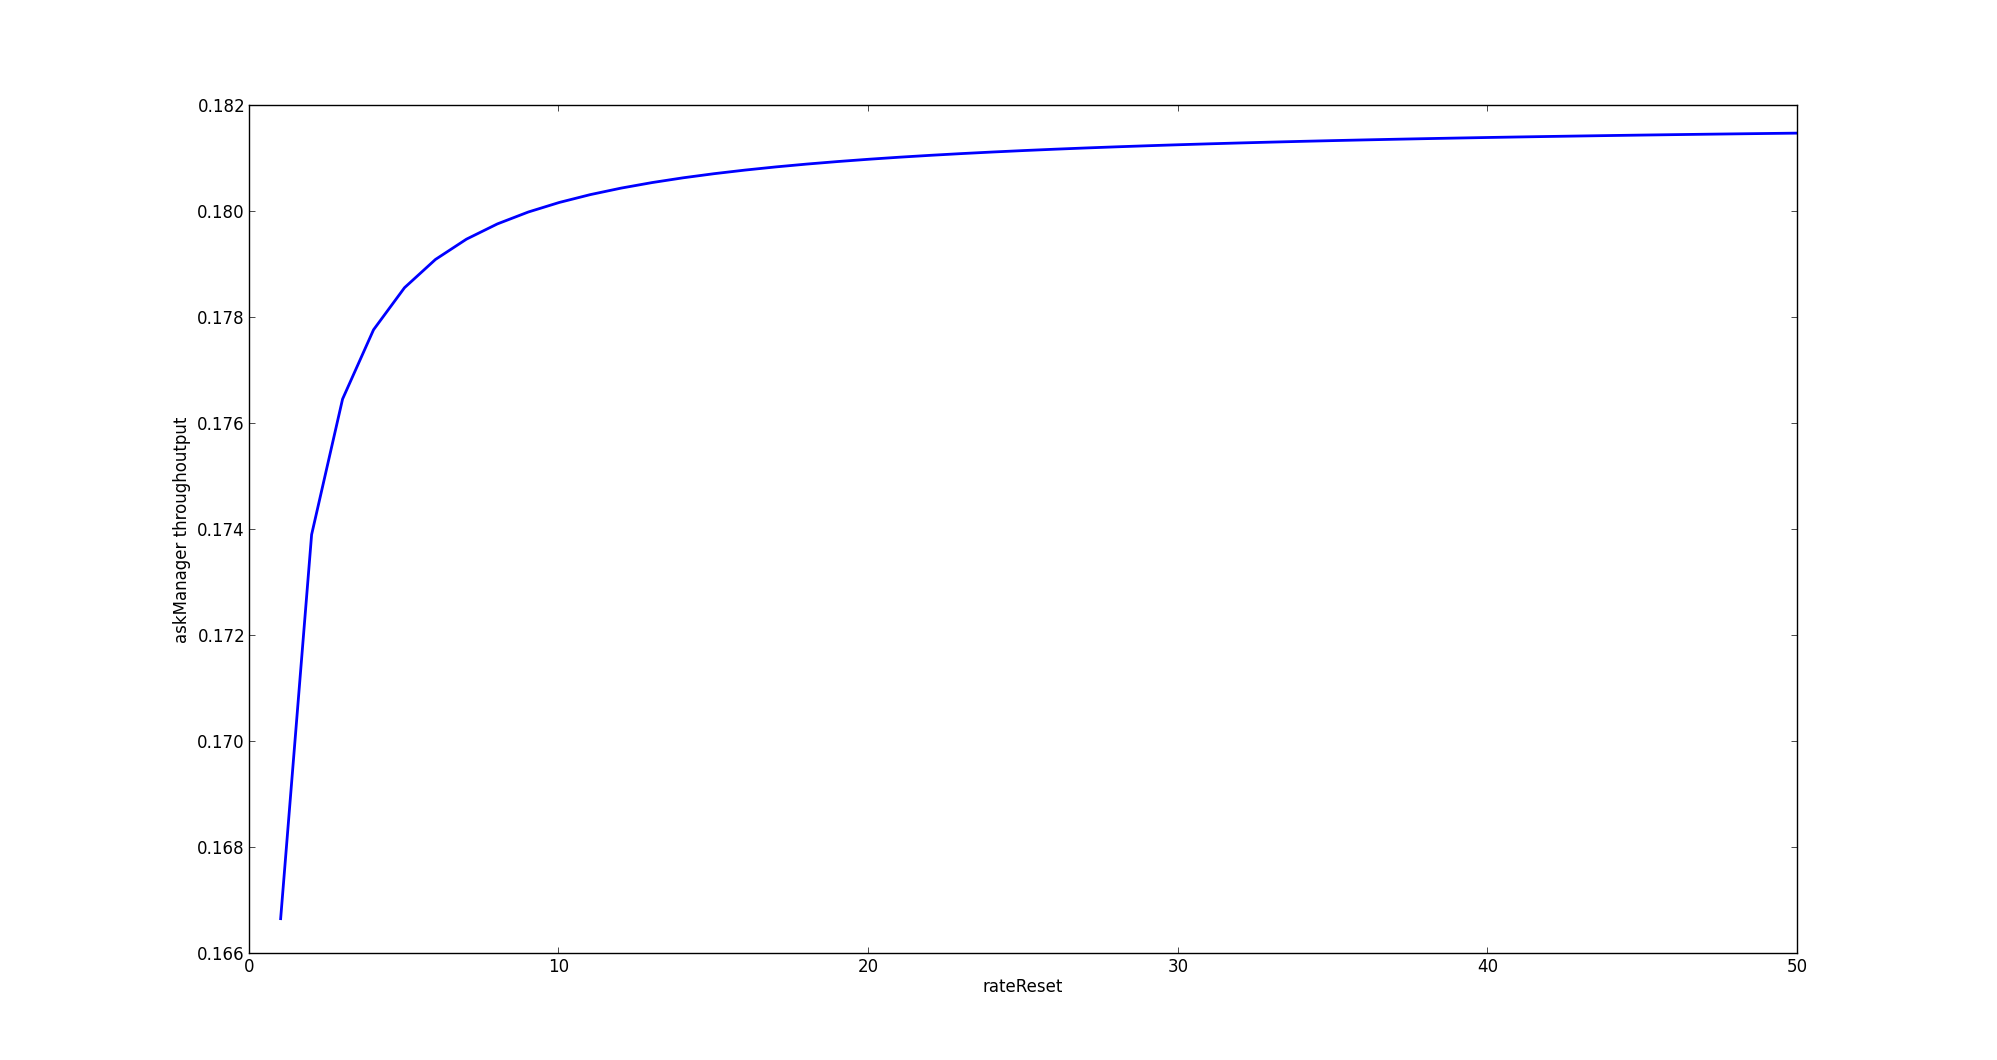
Finally pypepa can provide us with a tool for experimentation with rates and actions.
Let’s check how throughtput of askManager action changes when rateReset changes from 1 to 50 with step 1. The default result of this command will be a matplotlib graph.
The format of -var is “vartype:varname:value range specifier:value range value”. The one valid
vartype for now is rate, for value range specifiers you can choose: range or list. For range
you need to provide START, STOP, STEP, whereas for list a comma separated list of values.
You can specify other output options with -f argument: graph, console, csv.
$ pypepa -var "rate:rateReset:range:1,50,1" -val askManager models/bankscenario.pepa
Formatting
You can specify formats of -st, -th and --varrate with a --format option.
Currently we support CSV (although ; not comma delimited), console (the default) and graph (only
for varrate experiments). Additionally you can specify -o|--output option with a file argument to specify where to save the CSV.
$ pypepa -st models/bankscenario.pepa -f csv -o bank_steady.csv
The command will output a bank_steady-steady.csv, analogically for utilisation it will be
-utilisation postfix and for transient analysis -transient
Generating state space graphs
By specifying -gd|--gendots DIR you tell pypepa to generate dot files for graphiz in a directory
DIR. Dot files can be processed by graphiz package or displayed more interactively using xdot package that can be
installed from PyPI (pip install xdot).
$ pypepa -gd dots tests/simple.pepa
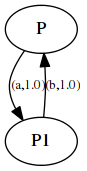
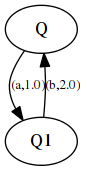
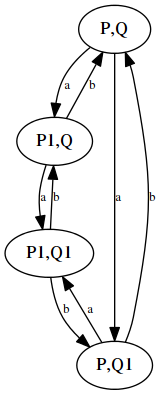
This command will generate a dot file representing state space of each component, as well as for of the whole state space. Below you can see an exemplary output:
| Component P | Component Q | Whole state space |
|---|---|---|
|
|
|